This paper will prove that the BAPI’s Volatile Organic Compound (VOC) sensor is an accurate and reliable way of incorporating Demand-Controlled Ventilation (DCV) into a building’s HVAC strategy. It will also show that the VOC sensor is as good an indicator of space occupancy as a CO2 sensor while also measuring other air contaminants which affect human comfort and health. The paper will also describe how the VOC sensor output corresponds to the CO2 level in the space so that system designers can use their existing CO2-based DCV occupancy algorithms. Finally, it will detail how proper ventilation from the VOC sensor improves occupant comfort, health and productivity, and saves money for building owners.
CO2 and Demand-Controlled Ventilation
Until now, Indoor Air Quality (IAQ) has been defined as proper temperature, humidity and CO2 levels. According to tenants however, offensive odors, smoke, carpet off-gassing and other VOCs have just as much or more impact on human comfort, productivity and health.
Then why is IAQ so closely linked to CO2? This is due to one interpretation of The American Society of Heating, Refrigerating, and Air-Conditioning Engineers (ASHRAE) Standard 62.1. This standard establishes minimum ventilation rates for proper IAQ, allowing for DCV which saves on heating and cooling costs by bringing in outside air only as it is needed. Standard 62.1 has two procedures for establishing the ventilation rates — one based on IAQ and contaminants and the other based on occupancy. The occupancy procedure, formally called the Ventilation Rate Procedure or VRP, is used most often due to its straightforward math, and the vast majority of system designers who choose VRP also choose CO2 sensors to determine the occupancy of the space.
The main drawback with this method of DCV is that it ignores the offensive odors, air contaminants and VOCs that may be present even when the CO2 levels are low¹. As stated earlier, Standard 62.1 has two procedures, one based on occupancy and the other based on IAQ and air contaminants. The difficulty with the IAQ procedure is that HVAC system designers must use subjective criteria, such as whether the air quality is acceptable to 80% or more of the building’s occupants. System designers are not comfortable dealing with these subjective perception-based criteria, so most choose the CO2 occupancy method, even though it ignores other air contaminants.
BAPI’s VOC sensor offers the best of both worlds. It allows for ventilation based on occupancy as well as air contaminants. The BAPI unit does this because it has been optimized for DCV. Using a calibration algorithm, the sensor value is converted to an output with a high correlation to a CO2 level. This lets you use Ashrae’s more popular and straight forward occupany-based VRP schedule. More information on this correlated CO2 output is included in the next section, but let’s start with the VOCs themselves.
What are VOCs and Where Do They Come From?
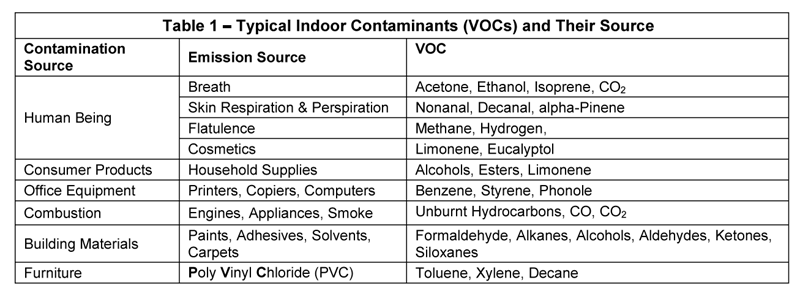
VOCs are chemicals that contain carbon and can be emitted as gases at room temperature. Table 1 shows some typical indoor contaminants and their sources. VOCs evaporate from substances, such as cleaning products, adhesives, paints, dry-cleaning fluids and wood preservatives. VOCs are also emitted from humans and animals in their breath, sweat and directly from their skin. In fact, the majority of VOCs in an indoor space are generated by humans. The BAPI sensor is able to measure these VOCs, and that is why the sensor is as good an indicator of occupancy as a CO2 sensor.
Space Occupancy — VOC Sensing versus CO2 Sensing
Extensive research was conducted on VOCs and CO2 in 1,500 offices, schools and homes to determine the correlation between CO2 levels and VOC levels. This research was used to create correlated CO2 output for the BAPI VOC sensor. The accuracy of this output as compared to CO2 levels is shown in the following seven charts.
These charts were taken Jan. 3-9, 2011, in a Kitchen and Dining area of a public school in Wisconsin. This location is a true multi-purpose area. It is used for breakfast, morning snacks, lunch, and after school studies during the day, and athletic practices, exercise classes and occasional meetings in the evenings. The VOC and CO2 sensors are located next to each other in the dining room near the kitchen entrance. The open percentage of the outdoor air damper for this area is controlled by the VOC sensor output through a PID control loop from 5 am to 2 pm on weekdays when the space is considered “occupied”. The outside air damper is closed during the unoccupied period, and ventilation is accomplished by diffusion from the adjacent hallways.
The following charts show the output of the VOC Sensor and CO2 Sensor and the Outside Air Damper position during a typical week from Monday through Sunday. These charts show that the output of the VOC sensor has a high correlation to CO2 levels and is reliable, predictable and repeatable.
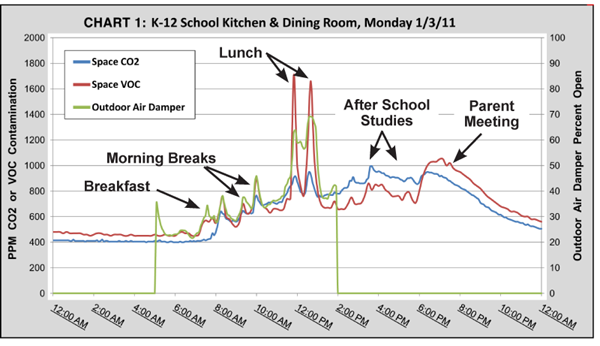
Chart 1, Monday:
The area goes into occupied mode at 5 am and the outdoor air damper — the green line — begins to track the output of the VOC sensor — the red line. At 7 am, the VOC sensor picks up the breakfast cooking aromas and activities. The CO2 sensor climbs a short time later as the students arrive to eat. The VOC sensor has slightly higher readings than the CO2 sensor during breakfast and the morning breaks because the VOCs from the food are added to the VOCs generated by the people. This is also seen at lunch as cooking of the sausage pizza generated lots of VOCs which are added to the VOCs from the students and staff. Additional fresh air is brought in to dilute the VOCs during the lunch period.
The outdoor air damper is closed at 2 pm but the room is still in use for “After School Studies” so the VOCs and CO2 rise a little during this period from 2:30 to 5 pm. Interestingly there is a community meeting in the dining room at 6 pm, and the audience is mostly adults. Notice how the VOCs track slightly below the CO2 during the “After School Study” period when it is mostly kids in the room. Then the two switch and the VOCs track slightly above the CO2 during the community meeting period when it is mostly adults in the room. That’s because adults use more perfumes and colognes than kids, and therefore generate more VOCs than kids.
Whether it’s kids or adults in the room, and whether they’re studying or eating, the chart shows that the VOC sensor output directly correlates to occupancy in the area. The chart also shows that using the VOC sensor to control the outdoor air damper results in appropriate ventilation for the space.
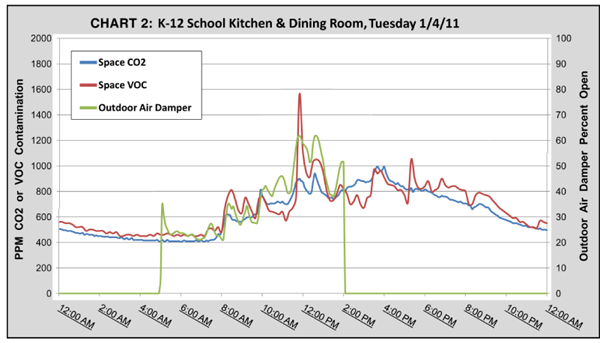
Chart 2, Tuesday:
The area again goes into occupied mode at 5 am and there are increases in VOCs and CO2 during breakfast, morning break, lunch and after school studies. There is a small spike in VOCs at about 5:45 due to Pee Wee wrestling practice which takes place in a performance area just across the hall from 6 to 8 pm. The dining room is used as a rest area for parents and as a place for the wrestlers to store their gym bags during practice, which accounts for the increase in VOCs at that time.
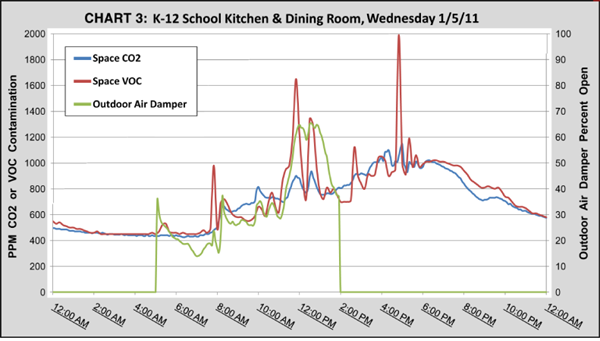
Chart 3, Wednesday:
The daytime portion of Wednesday is similar to Monday and Tuesday with increases in VOCs and CO2 during breakfast, midmorning break and after school studies, and spikes in VOCs due to cooking at lunch. There is a large spike in VOCs at about 4:45 pm due to a general exercise class for students. People generate more VOCs when they’re exercising, and the students also brought in gym bags and put on exercise clothing which added to the VOCs at that time.
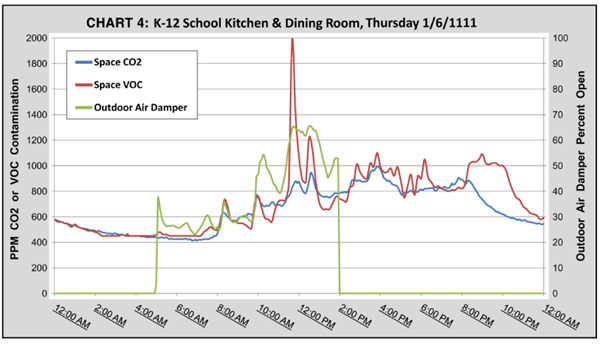
Chart 4, Thursday:
The daytime portion of Thursday is similar to the rest of the week with increases in VOCs and CO2 during breakfast, midmorning break and after school studies, and spikes in VOCs due to cooking at lunch. There is an increase in VOCs at 6 pm (similar to Tuesday) due to the Pee Wee wrestling practice in the performance area across the hall. There is another increase in VOCs at 8 to 10 pm due to a parents meeting for the wrestlers in the dining area at that time.
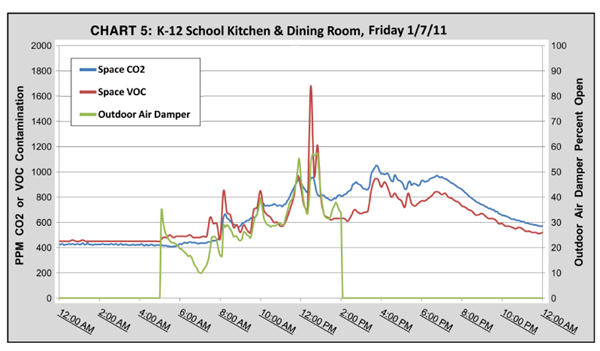
Chart 5, Friday:
The daytime portion of Friday is similar to the rest of the week with increases in VOCs and CO2 during breakfast, midmorning break and after school studies, and spikes in VOCs due to cooking at lunch. There is an increase in VOCs from 6:15 to 7:30 pm in the dining room area due to student traffic in the area from an athletic event in another part of the school building.
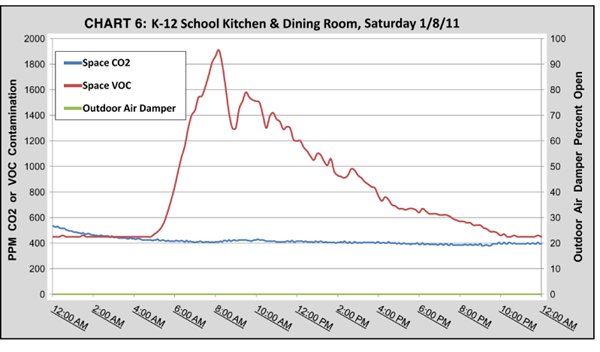
Chart 6, Saturday:
The space is considered unoccupied on Saturday so the Outdoor Air Damper is off. However, VOCs are being generated in the dining room from about 6 am to noon due to a Pee Wee Wrestling Tournament in the performance center across the hall. Wrestlers store their gym bags and other belongings in the dining area during the tounament, which accounts for the VOCs during that time. A CO2 sensor would not ventilate away these VOCs and odors.
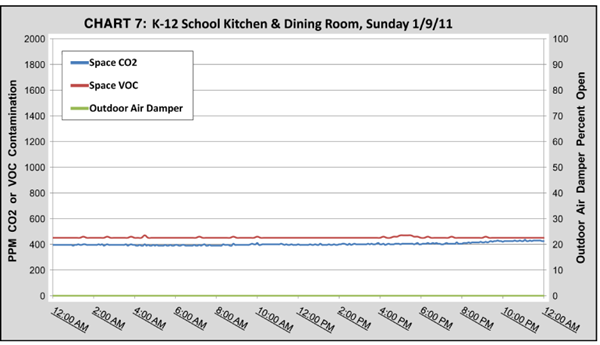
Chart 7, Sunday:
Sunday is the only day with no activity in the kitchen and dining area or the surrounding spaces, so there is only background levels of VOCs and CO2.
The True Meaning of Air Quality
VOCs are known to cause eye, nose and throat irritations, headache, drowsiness, dizziness, nausea, difficulty concentrating and fatigue; all summarized under the term SBS (Sick Building Syndrome). The importance of detecting the presence of VOCs in indoor air goes beyond these immediate health concerns. People judge the quality of the air not just by how it feels (temperature and humidity), but also by how it smells. Unfortunately, offensive odors in offices, kitchens, gymnasiums and restrooms have no impact on CO2 levels. A tuna fish sandwich left in a desk drawer over a weekend may not be life threatening, but may smell like it by Monday.
These obnoxious odors reduce everyone’s productivity until the odor is eliminated. In retail settings, customers may leave and never come back. Even small amounts can have a very immediate effect. A single person entering or passing through a space may deteriorate the air quality due to heavy amounts of aftershave lotion, cologne, perfume, hand soap, laundry detergent residue, fabric softeners or residual cigarette smoke.
In these cases a CO2 sensor will not correct the problem. For instance, a Circuit Court Judge in Tennessee was plagued by migraine headaches causing him to suspend proceedings until his headaches went away. A VOC sensor installed in the courtroom discovered that the Judge’s headaches were caused by support staff’s cosmetics. Proper ventilation reduced the VOCs to acceptable levels and the judge’s migraines stopped.
In another example, a plastic injection molding company’s staff was plagued by persistent minor upper respiratory ailments. A VOC sensor was installed and the customer thought it was faulty because the output stayed at maximum no matter how much outdoor air was admitted to the building. Subsequent troubleshooting revealed that a recently installed molding machine had its exhaust vented into the building’s fresh air intake duct by mistake. Within two weeks of rerouting the exhaust, all occupant respiratory symptoms disappeared. A CO2 sensor would not have sensed the contaminant from the molding machine.
The Financial Benefits of Appropriate Ventilation
One of the arguments used against VOC sensors is that because they sense odors and contaminants along with occupancy, that the building will be over-ventilated and therefore wastes energy. According to ASHRAE Standard 62.1 however, VOC sensors allow the building to be appropriately ventilated, not over-ventilated, and this appropriate ventilation will save building owners and tenants money in the long run².
The Building Owners and Management Association (BOMA) stated in a 1999 report that typical building operating costs are 83.3% personnel salaries, 13.5% rent, 2.1% repair and maintenance and 1.2% total energy costs (Heat, Air Conditioning, Lighting, Business Equipment Power, Water Heating, etc). Clearly, the cost of employees is by far the greatest expense to the tenant or owner/employer.
“It has now been shown beyond reasonable doubt that poor indoor air quality in buildings can decrease productivity as much as six to nine percent,” stated Professor David Wyon of the Technical University of Denmark’s International Centre for Indoor Environment and Energy.
Numerous domestic and international studies support Wyon, showing that appropriate ventilation leads to increased worker productivity, increased worker accuracy, higher morale, less absenteeism and lower health insurance costs from fewer and less costly claims. For a tiny increase in total operating costs to ensure appropriate ventilation, owners/occupants can experience significant increases in employee productivity and significant decreases in employee expenses.
Because complaints about comfort are the number one reason tenants choose to leave a space, assuring indoor air quality with appropriate ventilation means that building owners will lose less tenants. They may even be able to increase rents by showing increased tenant productivity and comfort.
References
- J Murphy, B Bradley 2005 “CO2-Based Demand-Controlled Ventilation with ASHRAE Standard 62.1-4004” Trane Engineers Newsletter Vol. 34 No. 5
- O Seppanen, W Fisk, P Wargocki Winter 2007 “Indoor Environment, Productivity in Offices” ASHRAE IAQ Applications Vol. 8 No. 1
Other References of Interest
- United States Environmental Protection Agency 2009 “Ventilation and Air Quality in Offices”
- ASHRAE 2009 “Thermal and air quality acceptability in buildings that reduce energy by reducing minimum airflow from overhead diffusers.” Research Project 1515-TRP
- United States Environmental Protection Agency 2008 “Indoor Air Facts No. 4, Sick Building Syndrome”
- ASHRAE 2007 Standard 62.1-2007 Ventilation for Acceptable Indoor Air Quality
- C Acevedo, E Sanchez, J Reyes, M Young November 13, 2007 “Volatile Organic Compounds Produced by Human Skin Cells” Biological Research Vol. 40 No. 3
- D Stanke Winter 2007 “The IAQ Procedure in Standard 62.1-2004” ASHRAE IAQ Applications Vol. 8 No. 1
- D. P. Wyon 2004 “The effects of indoor air quality on performance and productivity” Indoor Air Vol. 14 No. 7
- O Seppanen, W Fisk 2003 “A conceptual model to estimate cost effectiveness of the indoor environment improvements”. Proceedings of the Healthy Buildings 2003 Conference, December 7-11, 2003, Singapore. Volume 3, pp. 368-374.
- R Djukanovic, P Wargocki, & PO Fanger 2002 “Cost-Benefit Analysis of Improved Air Quality in an Office Building” Proceedings: Indoor Air 2002
- P Wargocki Fall 2002 “Making the Case for IAQ” ASHRAE IAQ Applications Vol. 3 No. 4
- S Hansen 1997 ”Economical consequences of poor indoor air quality and its relation to the total building operation costs.” EuroFM/IFMA Conference & Exhibition.
- M Phillips, J Greenberg & J Awad 1994; 47 “Metabolic and Environmental Origins of Volatile organic compounds in breath.” Journal of Clinical Pathology
- Iowa Energy Center June 2009 “Product Testing Report, Wall Mounted Carbon Dioxide (CO2) Transmitters”
- W Fisk 2008 “A Pilot Study of the Accuracy of CO2 Sensors in Commercial Buildings” Lawrence Berkeley National Laboratory Paper LBNL’260E
If you have any additional questions about the BAPI VOC sensor, please contact your BAPI representative.
Printable pdf Version of this Application Note